Space resolved optical spectroscopy on Fe-doped SrTiO3 single crystals
 of a Fe-doped SrTiO3 single crystal sample after pO2 change at elevated temperatures. (a) surface reaction (b) bulk diffusion (c) transport across grain boundary is limiting.")
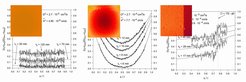
Fig. 1: Concentration profiles and false-color images (insets) of a Fe-doped SrTiO3 single crystal sample after pO2 change at elevated temperatures. (a) surface reaction (b) bulk diffusion (c) transport across grain boundary is limiting.

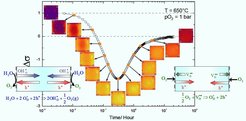
Fig. 2: Increase of pH2O from 4 to 20 mbar, monitored by optical spectroscopy and electrical conductivity