Size effects in nanocrystalline SrTiO3
. The green dashed line shows the purely electronic conductivity and hence the p-n transition (conductivity minimum). The horizontal line represents the sum of p and n-type conductivity at corresponding to . Reproduced by permission of John Wiley & Sons, Inc.")
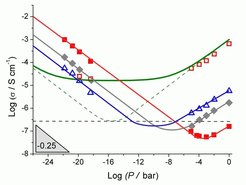
Fig. 1 Conductivity as a function of the oxygen partial pressure P measured at 544°C for various nominally undoped SrTiO3 samples. The symbols are assigned as follows: red open squares refer to the bulk of the microcrystalline SrTiO3 obtained by annealing the nanocrystalline sample at 1250°C for 4 hours; blue open triangles to the grain boundaries of the microcrystalline SrTiO3; grey diamonds to nano SrTiO3 50 nm; solid red nano to SrTiO3 with the effective grain size of ~30 nm. The green line correspond to the expected bulk conductivity calculated according to the bulk defect chemistry of SrTiO3 for the same acceptor impurities content (m = 0.01 at.%). The green dashed line shows the purely electronic conductivity and hence the p-n transition (conductivity minimum). The horizontal line represents the sum of p and n-type conductivity at corresponding to . Reproduced by permission of John Wiley & Sons, Inc.